AI Agent ROI Calculator: Estimate Payback Before You Build

Most AI vendors show you a projected ROI number during the sales call. That number survives until it meets your actual EDI formats, your actual WMS API limitations, and your actual exception rate on non standard submissions. The AI ROI calculator works differently. You enter your own workflow volume, your own cost per unit, and your own realistic automation coverage estimate. The output is an annualized savings figure, a payback period, and a breakeven point that you can pressure test against your actual operation before talking to anyone.
The AI ROI calculator is built for 3PL operations managers, MGA principals, and job shop owners evaluating whether a custom AI agent build clears the financial threshold for their specific workflow. The tool produces an estimate based on the inputs you provide. It is not a quote, a proposal, or a basis for contract.
What This Calculator Does and How to Use It
Enter four inputs. The calculator returns three outputs. No email gate, no lead form. If the numbers work and you want to move forward, the inputs pre fill the Assessment request automatically.
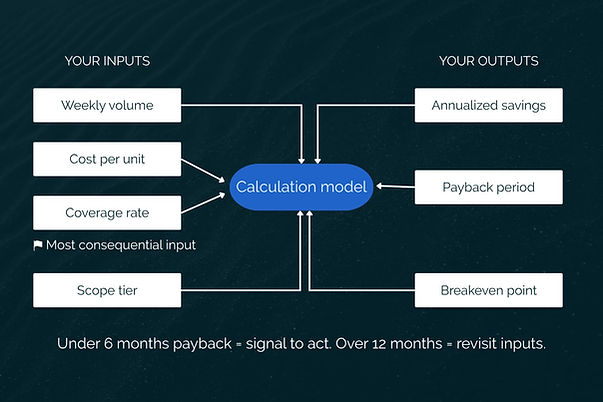
Weekly Workflow Volume
The number of units your team processes per week on the workflow you are evaluating. For 3PLs: orders processed, clients onboarded, or exception events handled. For MGAs: submissions triaged, documents extracted, or policies bound. The realistic range for the operators this calculator serves is 50 to 2,000 per week.
Use your actual number. Pull it from your TMS, WMS, or agency management system. A gut estimate produces a gut quality output.
Current Cost Per Unit
The fully loaded labor cost to complete one unit of the workflow today. This includes the staff time spent on intake, processing, review, exception handling, and system entry for a single order, submission, or onboarding event.
If you do not track this directly, calculate it: (hours per week your team spends on the workflow × average burdened hourly rate) ÷ weekly volume. For MGA submission processing, the typical range is $8 to $35 per submission depending on complexity and document volume. For 3PL order intake, the range is $3 to $15 per order depending on EDI complexity and exception rate.
Automation Coverage Rate
The share of units the agent handles end to end without human review. For regulated workflows with document variability (MGA submissions, compliance heavy 3PL onboarding), 60 to 80% straight through processing is a realistic steady-state target. Workflows with cleaner, more structured inputs (standard EDI orders, templated documents) can reach 80 to 90%.
If a vendor tells you 95% automation coverage on a workflow with high document variability, adjust downward before running the calculator. This input is where the estimate either reflects reality or produces a number that falls apart on contact with your actual operation.
Scope Tier
Three tiers defined by workflow scope.
Single workflow: One process, one integration layer. Invoice reconciliation, basic order intake, or single format document extraction. Setup in the low twenties of thousands, monthly in the low to mid thousands.
Multi system: Workflow crosses two or three systems with conditional logic and decision points. EDI onboarding spanning WMS, billing, and customer portal. Submission triage across agency management system, carrier portals, and compliance tracking. Setup in the mid twenties to low thirties, monthly in the mid thousands.
Compliance included: Multi system workflow with audit trail requirements, regulatory documentation, and human in the loop approval gates. Setup in the thirties to low forties, monthly in the mid to high thousands.
Reading Your Output and What It Can't Tell You
The AI ROI calculator produces three numbers. Each one answers a specific question, and each one has limits.
Annualized Savings
Gross labor cost on the automatable share of the workflow, minus the annualized subscription cost.
Formula: (Weekly volume × automation coverage rate × current cost per unit × 52 weeks) minus (monthly subscription × 12 months) = annualized net savings.
The formula is visible so you can sense check the output against your own numbers. If the result looks too high, the most common cause is an inflated automation coverage rate.
Payback Period
Months of subscription savings needed to recover the setup fee.
Formula: Setup fee ÷ monthly net savings = months to payback.
Under four months is a strong signal. Four to six months is typical for well scoped engagements. Above twelve months is a flag: either the volume is too low, the cost per unit is too low, or the automation coverage assumption is too aggressive. Revisit your inputs before proceeding.
Breakeven Point
The monthly savings figure at which the engagement becomes self funding. This helps operators with tight margins understand the minimum volume required to justify the build.
If your breakeven requires volume above your current throughput, the build depends on growth assumptions. That is a different risk profile than a build that pays back at current volume.
What the AI ROI calculator cannot account for: integration complexity between your specific systems, change management cost within your team, agent ramp time during the first 60 to 90 days when accuracy is below steady state, data quality constraints that reduce actual coverage below your input, and compliance requirements that affect deployment model and cost tier. These variables are resolved during the Assessment, not in a self serve calculator.
When the Math Works and When It Doesn't
Two patterns separate builds that clear the payback threshold from those that do not.
Builds That Typically Clear the Threshold
Structural characteristics of sub six month payback builds: weekly volume above 100 units, two or more systems of record involved in the workflow, realistic automation coverage at 60% or higher, and current cost per unit above $8.
These conditions appear consistently in 3PL onboarding workflows (18 clients per quarter, two week manual cycle, setup in the low twenties, payback month three) and MGA submission triage (200+ submissions per month across multiple carrier portals, cost per submission in the mid teens or higher).
Builds That Usually Don't
Four patterns produce payback periods above twelve months.
Low volume. Fewer than 50 units per week rarely justifies a custom build. The fixed setup and monthly costs spread across too few units to produce net savings. Consider a SaaS tool first: Lindy, Gumloop, or Zapier Agents handle low volume, single system workflows at a fraction of the cost.
Single system. If the friction lives entirely inside one platform (WMS, TMS, or agency management system), the vendor's built in features or a lightweight integration may cover the requirement without a custom agent.
Sub $5M revenue. The staffing model at this scale often means one person handles the entire workflow part time. The labor cost being automated is too small to offset the build investment.
Coverage assumption above 90% on a compliance workflow. Regulated workflows with high document variability and human review requirements will not sustain 90%+ straight through rates. Bring the coverage rate down to 65 to 75% and rerun the numbers.
How to Pressure Test Your Estimate Before the First Conversation
Three preparation steps replace assumptions with data and make the qualification conversation more productive.
Verify Your Volume Number
Pull the number from a report. In a TMS, run a shipment count for the past 90 days and divide by 13 weeks. In a WMS, pull receiving events or outbound orders. In an agency management system, count submissions processed per month. The calculator is only as reliable as this input.
Map Your Systems of Record
List every system the workflow touches. For 3PLs: WMS, TMS, EDI translator, carrier portals, customer facing tracker, billing software. For MGAs: agency management system, carrier submission portals, email, compliance documentation system.
System count is the strongest predictor of whether a custom build is the right call. Single system workflows often fit a SaaS solution. Workflows spanning three or more systems with data handoffs between them are where custom agents produce value that platforms cannot replicate.
Know Your Prior Attempts
If you tried Zapier, Lindy, or another self serve tool and hit a wall, that experience is the most useful data point you bring to the conversation. Identify what the platform could not do: memory across sessions, integration depth with a specific system, exception handling for non standard inputs, or compliance logging. That gap is where the custom build earns its cost.
How AI Agents Actually Handle Workflow Automation: What the Numbers Assume
The AI ROI calculator models a system where the agent handles the predictable share of the workflow and routes exceptions to humans. Understanding that operating model improves the quality of the inputs you provide.
Straight Through Processing vs. Human in the Loop
Straight through processing applies to high confidence, structured inputs: standard EDI orders with clean data, ACORD submissions with all required fields populated, invoices from known vendors in familiar formats. The agent processes these end to end without human review.
Human in the loop applies to exceptions, edge cases, and compliance flagged documents: a submission with missing fields, an EDI format the agent has not seen before, a document that requires human judgment on a coverage question. The agent escalates these with full context attached, and the human reviewer makes the final decision.
The split between straight through processing and human in the loop review is what the automation coverage rate input represents.
How Accuracy Compounds Over the First 90 Days
Agents improve as they process more of your actual data. The automation coverage rate in week one is lower than the steady state assumption in the AI ROI calculator because the agent is still learning your specific formats, vendor patterns, and exception types. By day 60 to 90, the agent has processed enough volume to reach the automation coverage rate your estimate assumes.
Think of the AI ROI calculator output as a 90 day steady state figure, not a day-one result. The ramp curve is real, and the first 90 days require more human oversight than the model projects.
The Role of Data Quality in Coverage Rate
Poor input data reduces straight through rates regardless of how well the agent is built. Inconsistent field names in EDI documents, missing values in submission forms, and unstructured email attachments all force the agent into human in the loop mode more frequently.
One practical signal: if your current human workflow requires frequent judgment calls on incomplete or inconsistent inputs, your automation coverage assumption should come down before the calculator output is reliable. Clean, structured input data is the precondition for the higher end of the coverage rate range.
Vertical Specific Benchmarks: 3PL and MGA Operators
The following benchmarks are drawn from a small number of reference engagements and are representative, not statistically validated.
3PL Multi Channel Intake and Onboarding Benchmarks
Weekly volume range: 100 to 500 orders or 4 to 18 onboarding events per quarter.
Fully loaded cost per event: $12 to $40 for order intake, $800 to $2,200 in staff time per onboarding event.
Typical automation coverage at steady state: 65 to 80% for order intake, 60 to 75% for onboarding (EDI format variability is the primary constraint).
Resulting payback range: 3 to 5 months for order intake, 3 to 4 months for onboarding at the volume ranges above.
MGA Submission Processing Benchmarks
Monthly submission volume: 150 to 600.
Cost per submission at current staffing: $12 to $35 depending on complexity and document count.
Typical straight through rate: 70 to 85% for clean ACORD submissions with all required fields, 50 to 65% for complex or incomplete submissions requiring follow up.
Resulting payback range: 4 to 6 months at mid range volumes.
Where compliance requirements (NAIC reporting, carrier audit preparation) are part of the workflow, the scope tier moves to compliance included, which affects the setup and monthly cost.
From Calculator to Assessment: What the Estimate Doesn't Replace
The AI ROI calculator gives you a directional number. The Assessment gives you a defensible one built on your actual workflow, your actual systems, and your actual data.
What the Assessment Delivers That the Calculator Cannot
Four outputs that self serve inputs cannot produce: an integration feasibility finding based on your actual system APIs and data formats, a stack specific automation coverage estimate validated against your real document population, a build vs. buy vs. wait recommendation with reasoning tied to your specific conditions, and a ranked opportunity list with ROI projections for each candidate workflow.
The Assessment takes two weeks, is delivered by a senior engineer, and produces a written recommendation with specific deliverables.
How the Credit Works If You Proceed to a Build
50% of the Assessment fee is credited toward the Agents setup fee if you proceed within 30 days. The Assessment is a standalone deliverable regardless: if you do not proceed, you keep the workflow analysis, coverage estimate, and recommendation. The credit mechanism makes the Assessment cost neutral for operators who move forward.
Your Next Move
A sub six month payback is a signal worth acting on. A fourteen month payback is useful information that saves you from spending a dollar you would not recover. Either way, the AI ROI calculator did its job.
If the numbers work, the next step is the AI ROI Assessment: two weeks, fixed fee, engineer led, specific deliverables.
Start the AI ROI Assessment with us and get a workflow specific recommendation built around your actual systems, operational constraints, and automation potential.
Frequently Asked Questions
How accurate is this estimate for my specific operation?
The AI ROI calculator produces a directional estimate based on four inputs. Accuracy depends on the quality of those inputs, especially the automation coverage rate and the cost per unit figure. Operators who pull volume from system reports and calculate cost per unit from actual labor data get estimates that hold up well in Assessment validation. Operators who estimate both inputs from memory get numbers that may shift significantly when real data is applied.
Why is this not a quote?
A quote requires understanding your specific systems, data quality, integration complexity, and compliance requirements. The AI ROI calculator knows none of these. The tool applies a formula to your inputs and returns a mathematical result. The Assessment is where an engineer evaluates the actual conditions and produces a scoped recommendation.
What is the difference between automation coverage and full automation?
Automation coverage is the share of workflow units the agent handles end to end without human review. Full automation would mean zero human involvement on any unit. Full automation is not the target for regulated or document variable workflows. Realistic automation coverage rates are 60 to 80% at steady state, with the remaining 20 to 40% routed to human reviewers as exceptions.
My payback period came out above twelve months. Does that mean a build does not make sense?
It means the build does not make sense at current inputs. Check three things: is the workflow volume too low (under 50 per week), is the cost per unit too low (under $5), or is the automation coverage assumption too aggressive for the document variability in the workflow? Adjusting any of these may change the result. If the math still does not work, a self-serve tool or a SaaS platform is the better fit at current scale.
I tried a self serve tool and it did not work. Does that change anything about these numbers?
It changes the context, not the math. If you tried Zapier, Lindy, or a similar platform and hit limitations on memory, multi system integration, or exception handling, those limitations are the reasons a custom build costs more and the reasons a custom build produces different results. The AI ROI calculator math stays the same. The build decision is informed by knowing specifically what the self-serve platform could not do.
How does data quality in my current systems affect the output?
Directly. If your source data has inconsistent fields, missing values, or unstructured formats, the actual automation coverage rate will be lower than the number you entered. The AI ROI calculator does not adjust for data quality. If your current human workflow requires frequent judgment calls on incomplete inputs, reduce the automation coverage rate input by 10 to 15 percentage points before treating the output as reliable.